Usage Tracking
Track and monitor how your data products are being used by sending usage data to Entropy Data using the OpenTelemetry Traces API. This enables you to understand how your consumers are using your data product, identify unmanaged consumers, and track usage trends.
Overview
Entropy Data provides an OpenTelemetry-compatible API endpoint that accepts trace data in the OTLP (OpenTelemetry Protocol) JSON format. Usage data is stored for 30 days and automatically visualized in the data product usage dashboard.
The usage tracking system supports:
- Query execution tracking (SELECT, INSERT, UPDATE, DELETE, etc.)
- User and role attribution
- Query result status (SUCCESS, FAILURE)
- Row count metrics
- Query preview text
- Asset/table access tracking
API Endpoint
POST /api/v1/traces
GET /api/v1/traces
DELETE /api/v1/traces
Authentication
All requests require an API Key with organization scope.
curl -H "X-API-Key: YOUR_API_KEY" \
     https://api.entropy-data.com/api/v1/traces
Sending Usage Data
Request Format
Usage data is sent as OpenTelemetry traces using the OTLP JSON format. The request structure consists of:
- Resource attributes - Identify the data product and service
- Scope - Define the type of telemetry (use
"usage"for query tracking) - Spans - Individual usage events with detailed attributes
Example Request
curl -X POST https://api.entropy-data.com/api/v1/traces \
  -H "X-API-Key: YOUR_API_KEY" \
  -H "Content-Type: application/json" \
  -d '{
    "resourceSpans": [
      {
        "resource": {
          "attributes": [
            {
              "key": "service.name",
              "value": { "stringValue": "snowflake" }
            },
            {
              "key": "dataproduct.id",
              "value": { "stringValue": "orders-data-product" }
            },
            {
              "key": "outputport.name",
              "value": { "stringValue": "orders_pii_v2" }
            },
            {
              "key": "outputport.version",
              "value": { "stringValue": "2.0.0" }
            }
          ]
        },
        "scopeSpans": [
          {
            "scope": {
              "name": "usage",
              "version": "1.0.0"
            },
            "spans": [
              {
                "traceId": "9f8c6b2e1d2b47b48a3aef4c2c5b7d10",
                "spanId": "123abc456def7890",
                "name": "usage",
                "kind": "SPAN_KIND_INTERNAL",
                "startTimeUnixNano": 1760488800000000000,
                "endTimeUnixNano": 1760488800050000000,
                "attributes": [
                  {
                    "key": "user",
                    "value": { "stringValue": "john.doe@example.com" }
                  },
                  {
                    "key": "role",
                    "value": { "stringValue": "DATA_ANALYST" }
                  },
                  {
                    "key": "query.type",
                    "value": { "stringValue": "SELECT" }
                  },
                  {
                    "key": "query.preview",
                    "value": {
                      "stringValue": "SELECT order_id, customer_id, total FROM orders WHERE date > '2024-01-01'"
                    }
                  },
                  {
                    "key": "result",
                    "value": { "stringValue": "SUCCESS" }
                  },
                  {
                    "key": "rows",
                    "value": { "intValue": 1523 }
                  },
                  {
                    "key": "access.id",
                    "value": { "stringValue": "047bde7c-87d4-488a-b6d2-cef6f6f60000" }
                  },
                  {
                    "key": "asset.ids",
                    "value": {
                      "arrayValue": {
                        "values": [
                          { "stringValue": "047bde7c-87d4-488a-b6d2-cef6f6f60000" }
                        ]
                      }
                    }
                  }
                ]
              }
            ]
          }
        ]
      }
    ]
  }'
Resource Attributes
Resource attributes identify the data product and service. These are set at the resource level.
| Attribute | Required | Type | Description |
|---|---|---|---|
service.name | No | string | The name of the service (e.g., "snowflake", "bigquery", "databricks") |
dataproduct.id | Recommended | string | The external ID of the data product |
datacontract.id | Optional | string | The external ID of the data contract (alternative to dataproduct.id) |
outputport.name | Optional | string | The name of the output port being accessed |
outputport.version | Optional | string | The version of the output port |
Note: Either dataproduct.id or datacontract.id must be provided to associate the usage data with a specific resource.
Scope Configuration
The scope defines the type of telemetry being sent. For usage tracking, use:
{
  "scope": {
    "name": "usage",
    "version": "1.0.0"
  }
}
Span Attributes
Span attributes capture details about individual usage events.
Core Attributes
| Attribute | Required | Type | Description |
|---|---|---|---|
user | Recommended | string | User identifier (email, username, or service account) |
role | Optional | string | User's role or permission level |
query.type | Recommended | string | Type of query (SELECT, INSERT, UPDATE, DELETE, etc.) |
query.preview | Recommended | string | Preview of the query (typically first 200 characters). Remove confidential information. |
result | Recommended | string | Query execution result (SUCCESS, ERROR) |
rows | Optional | integer | Number of rows returned or affected |
access.id | Optional | string | Reference to an access agreement |
asset.ids | Optional | array of strings | IDs of assets/tables accessed in the query |
Span Identifiers
| Field | Required | Type | Description |
|---|---|---|---|
traceId | Yes | string | Unique identifier for the trace |
spanId | Yes | string | Unique identifier for the span. This is the identifier. Sending the spanId again would overwrite existing spans. |
name | No | string | Name of the span (use "usage") |
kind | No | string | Span kind (use "SPAN_KIND_INTERNAL") |
startTimeUnixNano | Yes | integer | Start time in nanoseconds since Unix epoch |
endTimeUnixNano | Yes | integer | End time in nanoseconds since Unix epoch |
Retrieving Usage Data
You can retrieve stored usage data using the GET endpoint with optional filters.
Query Parameters
| Parameter | Type | Description |
|---|---|---|
scopeName | string | Filter by scope name (e.g., "usage") |
dataProductId | string | Filter by data product external ID |
dataContractId | string | Filter by data contract external ID |
Example
Get usage data for a data product
curl -X GET "https://api.entropy-data.com/api/v1/traces?scopeName=usage&dataProductId=orders-data-product" \
  -H "X-API-Key: YOUR_API_KEY"
The response follows the same OTLP JSON structure as the POST request.
Deleting Usage Data
You can delete usage data using the DELETE endpoint with the same query parameters.
Example
Delete all usage data for a data product
curl -X DELETE "https://api.entropy-data.com/api/v1/traces?scopeName=usage&dataProductId=orders-data-product" \
  -H "X-API-Key: YOUR_API_KEY"
Data Retention
Usage data is automatically deleted after 30 days. This retention period is enforced when new traces are submitted - the system automatically cleans up traces older than 30 days for your organization.
Best Practices
- Use consistent identifiers: Ensure
dataproduct.idmatches the external ID in Entropy Data - Include user context: Always populate the
userattribute for access auditing - Limit query preview size: Truncate queries to ~200 characters to avoid excessive storage
- Use appropriate query types: Standardize on query type values (SELECT, INSERT, UPDATE, DELETE)
- Track query results: Always include the
resultattribute to monitor failures - Unique span IDs: Generate unique
spanIdvalues for each usage event to allow updates - Batch submissions: For high-volume scenarios, consider batching multiple spans in a single request
Integration Examples
The following examples show how to track usage data for data products. The recommended workflow is:
- Query Entropy Data to get data products and their output ports
- Extract server configuration (database, schema) from output ports
- Query the data platform's query history filtered by database/schema
- Optionally filter by specific table names from data product assets
- Send filtered usage data to Entropy Data
Snowflake Query History
import snowflake.connector
import requests
import uuid
from datetime import datetime, timedelta

def get_data_products(api_key):
    """Fetch all data products from Entropy Data"""
    response = requests.get(
        "https://api.entropy-data.com/api/dataproducts",
        headers={"X-API-Key": api_key}
    )
    return response.json()

def get_snowflake_queries_for_output_port(snowflake_conn, database, schema, table_names=None, hours=24):
    """
    Query Snowflake query history filtered by database and schema.
    Optionally filter by specific table names from data product assets.
    """
    cursor = snowflake_conn.cursor()

    # Base query for query history
    query = """
        SELECT
            query_id,
            query_text,
            user_name,
            role_name,
            query_type,
            start_time,
            end_time,
            rows_produced,
            error_code,
            database_name,
            schema_name
        FROM snowflake.account_usage.query_history
        WHERE start_time >= DATEADD(hour, -%s, CURRENT_TIMESTAMP())
            AND database_name = %s
            AND schema_name = %s
    """

    params = [hours, database.upper(), schema.upper()]

    # Optionally filter by specific tables (from data product assets)
    if table_names:
        table_filters = " OR ".join(["query_text ILIKE %s" for _ in table_names])
        query += f" AND ({table_filters})"
        params.extend([f"%{table}%" for table in table_names])

    cursor.execute(query, params)

    columns = [desc[0].lower() for desc in cursor.description]
    results = []
    for row in cursor.fetchall():
        results.append(dict(zip(columns, row)))

    return results

def send_usage_to_entropy_data(api_key, data_product_id, output_port_name, queries):
    """Send filtered query history to Entropy Data as usage traces"""

    spans = []
    for query in queries:
        span = {
            "traceId": uuid.uuid4().hex[:32],
            "spanId": uuid.uuid4().hex[:16],
            "name": "usage",
            "kind": "SPAN_KIND_INTERNAL",
            "startTimeUnixNano": int(query['start_time'].timestamp() * 1_000_000_000),
            "endTimeUnixNano": int(query['end_time'].timestamp() * 1_000_000_000),
            "attributes": [
                {"key": "user", "value": {"stringValue": query['user_name']}},
                {"key": "role", "value": {"stringValue": query['role_name']}},
                {"key": "query.type", "value": {"stringValue": query['query_type']}},
                {"key": "query.preview", "value": {"stringValue": query['query_text'][:200]}},
                {"key": "result", "value": {"stringValue": "SUCCESS" if query['error_code'] is None else "FAILURE"}},
                {"key": "rows", "value": {"intValue": query['rows_produced'] or 0}}
            ]
        }
        spans.append(span)

    if not spans:
        return True

    payload = {
        "resourceSpans": [{
            "resource": {
                "attributes": [
                    {"key": "service.name", "value": {"stringValue": "snowflake"}},
                    {"key": "dataproduct.id", "value": {"stringValue": data_product_id}},
                    {"key": "outputport.name", "value": {"stringValue": output_port_name}}
                ]
            },
            "scopeSpans": [{
                "scope": {"name": "usage", "version": "1.0.0"},
                "spans": spans
            }]
        }]
    }

    response = requests.post(
        "https://api.entropy-data.com/api/v1/traces",
        headers={"X-API-Key": api_key, "Content-Type": "application/json"},
        json=payload
    )

    return response.status_code == 200

# Main workflow
def sync_snowflake_usage(entropy_api_key, snowflake_conn):
    """
    Complete workflow to sync Snowflake usage data for all data products
    """
    # Step 1: Get all data products from Entropy Data
    data_products = get_data_products(entropy_api_key)

    for dp in data_products:
        data_product_id = dp['id']

        # Step 2: For each output port, get server configuration
        for output_port in dp.get('outputPorts', []):
            output_port_name = output_port['id']

            # Extract database and schema from server configuration
            server_config = output_port.get('server', {})
            database = server_config.get('database')
            schema = server_config.get('schema')

            if not database or not schema:
                print(f"Skipping {data_product_id}/{output_port_name}: missing database/schema")
                continue

            # Step 3: Optionally get table names from assets
            table_names = None
            if 'assets' in dp:
                table_names = [asset.get('name') for asset in dp['assets']
                             if asset.get('name')]

            # Step 4: Query Snowflake for relevant queries
            queries = get_snowflake_queries_for_output_port(
                snowflake_conn,
                database,
                schema,
                table_names,
                hours=24
            )

            print(f"Found {len(queries)} queries for {data_product_id}/{output_port_name}")

            # Step 5: Send to Entropy Data
            if queries:
                send_usage_to_entropy_data(
                    entropy_api_key,
                    data_product_id,
                    output_port_name,
                    queries
                )

# Usage
snowflake_conn = snowflake.connector.connect(
    user='YOUR_USER',
    password='YOUR_PASSWORD',
    account='YOUR_ACCOUNT'
)

sync_snowflake_usage('YOUR_ENTROPY_API_KEY', snowflake_conn)
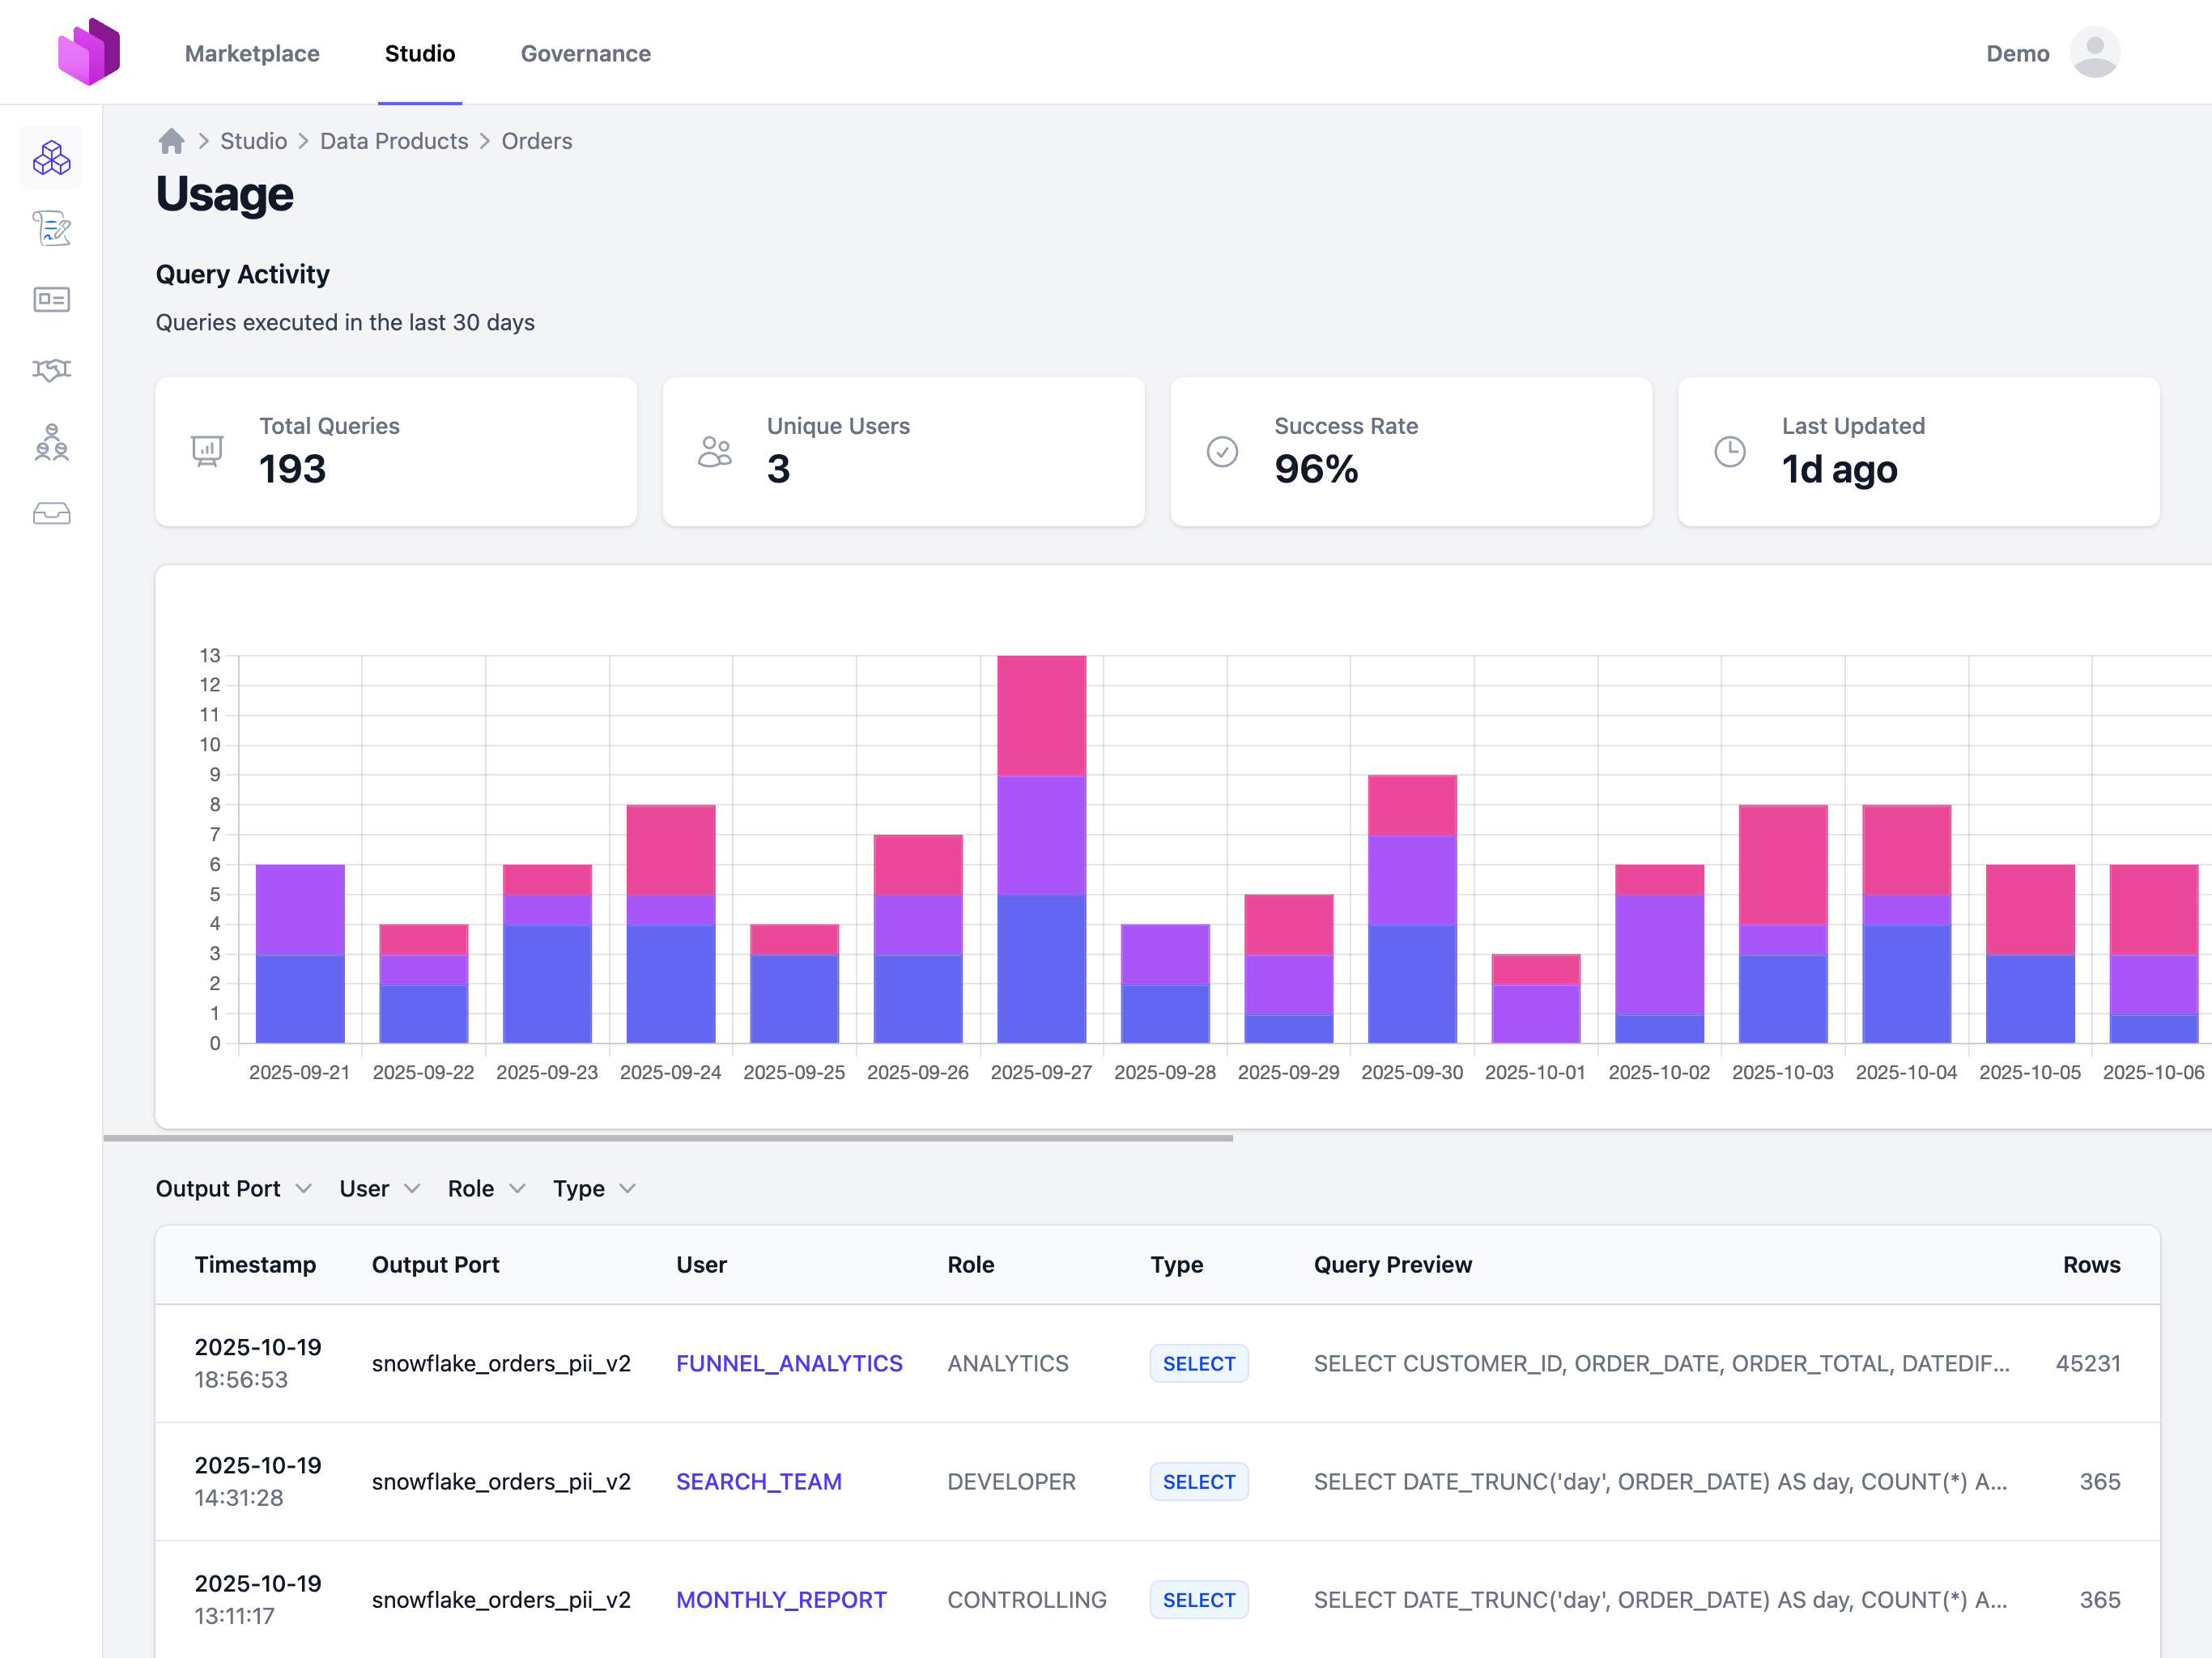
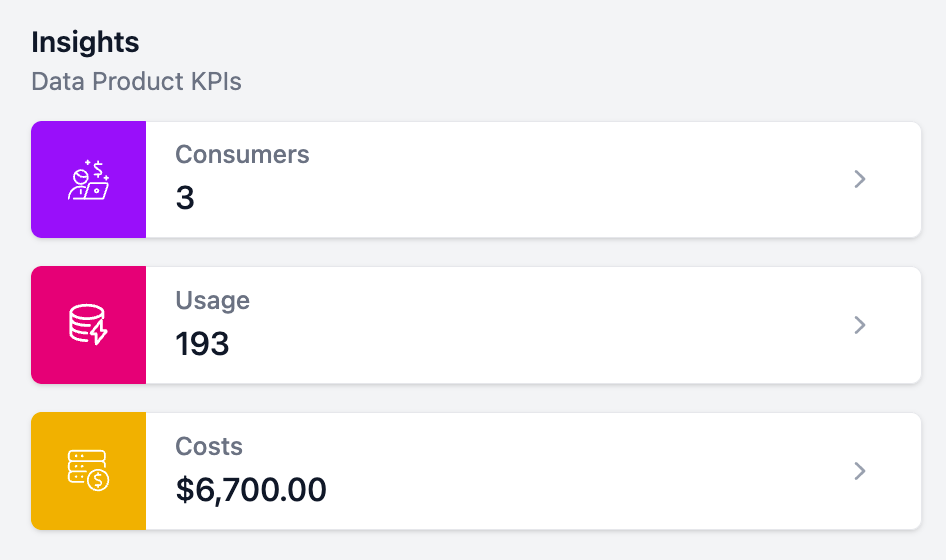
Viewing Usage Data
Once usage data is submitted, the Usage KPI becomes available on the data product page in the Studio. The KPI is only displayed to data product owners and team members with edit permissions.
To view usage data:
- Navigate to your data product
- Click on the "Usage" tab
- View charts and detailed query logs for the last 30 days
The usage dashboard displays:
- Query volume over time
- Top users by query count
- Query type distribution
- Success/failure rates
- Detailed query logs with all attributes
The detailed view shows individual query logs with all captured attributes:
Related Resources
- Observability - Configure OpenTelemetry for the Entropy Data application
- API Authentication - Learn how to create and manage API keys